FORECASTING AT HARD ROCK CAFÉ:

View a larger image by clicking here
DISCUSSION QUESTIONS:
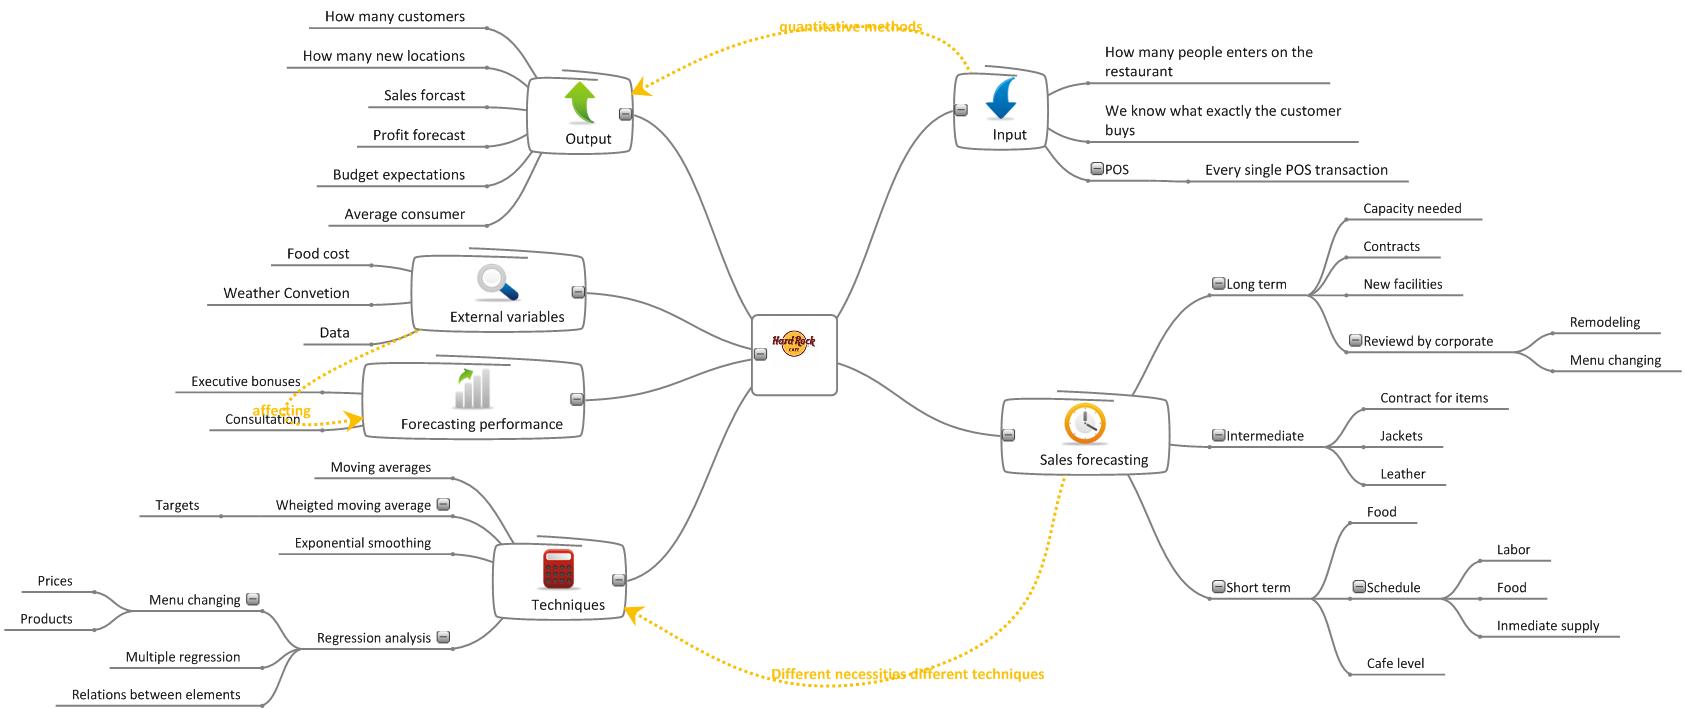
1. Describe three different forecasting applications at Hard Rock. Name three other areas in which you think Hard Rock could use forecasting models.
Sales forecasts:
- Long range forecasting: in setting a capacity plan
- Intermediate term forecasting: for locking in contracts for leather goods (used in jackets) and for food items as beef, chicken, and pork
- Short term forecasting: daily forecasts which contain the effect of special events in the town (including staff forecast)
Human Resources:
- Bonuses for managers: a 3-year weighted moving average is applied to cafe sales and if the cafe general managers exceed their targets, a bonus is computed
- Staff recruitment: Adapt the necessary workforce according expected demand.
- Staff management: Determine necessary roles on each section of the restaurant.
Menu planning/placement:
- Regression analysis.
- How could affect price variations on one product to the rest of the elements on the menu
- How could affect reorganizations of the menu to the sales.
Other possible areas of application:
- To include seasonal forecasting in the menu planning
- To predict customer behaviour changes.
- To apply forecasting to every single element of the menu.
- They could forecast "booming areas" to build a Hard Rock Cafe there.
- Forecasting of customer satisfaccion compared with real data from customer satisfaction surveys:
- Relate customer satisfaction delivered by each employee.
- Calculate the difference between the expetected global customer satsifaction against the real customer satisfaction for each employee.
- If real data outperforms data: bonuses for those employes attending that table.
- If real data is below forecasting: employee revision
2. What is the role of the POS system in forecasting at Hard Rock?
- POS stands for Point of Sale and could be defined as "the location where a transaction occurs".
- In Hard Rock it is mainly used to collect data about every person who walkes through a Hard Rock cafe's door.
- Data is automatically transmited to Corporate Headquarters' database in Orlando.
- This data can be clasified by customer and by teller.
- So in general the POS systems in Hard Rock cafe's collect datas of nearly all customers to get used to their habits and preferences.
- This information among the inputs for the forecasting process, which has to be done to be well prepared for the future.
3. Justify the use of the weighting system used for evaluating managers for annual bonuses.
The weighting system use the following pattern:

If actual sales are above forecasting then the executive will get bonuses. If actual sales are below forecasting a revision of the model should be taken into account as well as some other variables, like evaluating global performance of the Cafe).

Managers performance is evaluated by comparing actual sales with what could be considered a normal behaviour of the time series. The weighted moving average system considers recent trends, and old data are usually little taken into account, which is predominant for future sales. The 3-year weighted moving average ensures that managers take care about the company in long term, because they want to maximize their future earnings, causing a long appreciation of the company itself.
4. Name several variables besides those mentioned in the case that could be used as good predictors of daily sales in each cafe.
Each Hard Rock cafe, hotel or restaurant could do a customer´s survey to everyone who gets through the door, in which they could get data of:
- Customers ages
- Customers sexes
- Customers preferences for food, drinks, clothes, etc.
Knowing the main groups of ages and sexes between their customers, we could better select forecasting variables. A company profile is currently available at the internet by clicking here. Customer sources usually come from the local market and from visitors.
Some additional variables that could be useful to make more accurate forecasting could be:
- Weather conditions.
- Sport events on TV.
- Events on the city: cultural events, sport events, etc.
- Public holidays.
- Birth rate.
- Evolution of teenagers population.
- Number of business centers arround the restaurant: For business meals.
- Number of airlines operating in the local airport.
- Number of visitors to the city.
- Customer satisfaction data.
We consider that besides finding additional variables to improve our predictions, could also be useful to use other type of forecasting methods, like ARMA based models that in some cases could provide better forecasting results. ARMA based models exploit all the information contained on the time series.
5. At Hard Rock's Moscow restaurant, the manager is trying to evaluate how a new advertising campaign affects guest counts. Using data for the past 10 months(see the table) develop a least squares regression relationship and then forecast the expected guest count when advertising is $65.000.
We consider there is a relation between the money invested in advertising and the number of guests we get to our Hard Rock Café. Therefore we could define the following variables:
- y: Number of guests coming to our Hard Rock Café in kPersons (dependent variable).
- x: Investment in advertising in k$ (independent variable).
If we represent Number of guests (Guest count) vs Advertising we would obtain the following graphic:

Now it's time to determine an equation that defines the relation between the dependent variable (guest count) and the independent variable (advertising). In Excel we only need to click on "Add trend line" and choose the linear regression type.

The equation can be interpreted as: GuestCount(kPersons)=0,9236*Advertising(k$)+1,,7948. So if we invest 65.000 $ we would have the following number of guests:
GuestCount(kPersons)=0,9236*65+1,7948= 61,829 kPersons= 61.829 persons
The R square value (0,8733) shows what percentage of the monthly variation in guest count (y) is explained by the monthly variation in advertising investment. We can state that our linear relationship explains 87,33% of the variation in monthly guest count.
It's important to remember that we shouldn't use least-squares line to predict values of a variable that lie outside the range for which we have our data.
You can download the full Excel spreadsheet containing data and calculations by clicking here.
We've also prepared a short YouTube video with an explanaition about how to do our calculations:

6. Invent a collection of historical data for Guest count Hard Rock in Bombay (35 data series) and apply the forecasting time series models. Store all these procedures in a worksheet.

Click here to download the full excel spreadsheet
REFERENCES:
QUESTIONS FOR THE OTHER GROUPS CONCERNING THE HARDROCK CASE:
- HOTFIVE: What is/are the most important area/s forecasting is used for? Explain.
- GLOBAL TEAM: What will occur if the POS system of Hard Rock drops out?
- 4SERVICE: Do you think the bonus system of Hard Rock is an incentive for its managers? What other incentive could be used?
- MEJOP: Check the Excel Spreadsheet mentioned in Task 6 and detect the forecasting method with the smallest error in this example.
What is/are the most important area/s forecasting is used for? Explain.
Comments (0)
You don't have permission to comment on this page.